Dashboard
The Dashboard is the main landing page of the Beacon application, providing an overview of feature flag metrics.
Overview
The Dashboard displays key metrics and visualizations to help teams monitor their feature flag usage and health. It includes metric cards, charts, data tables, and an onboarding flow for new users.
Metrics are updated approximately every 60 seconds.
Onboarding Dialog
If you are new to Beacon, you will be greeted with a dialog that guides you through the setup process.
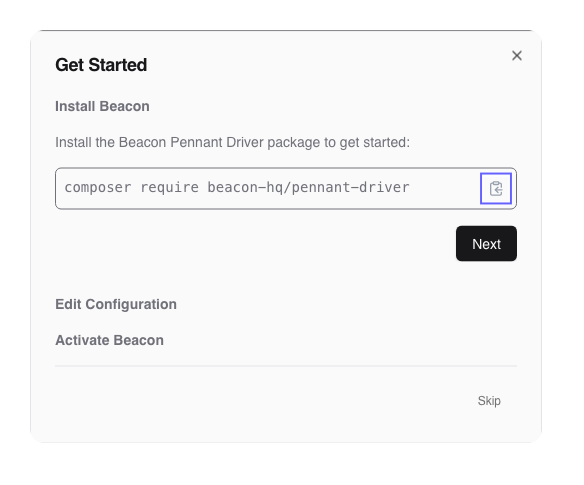
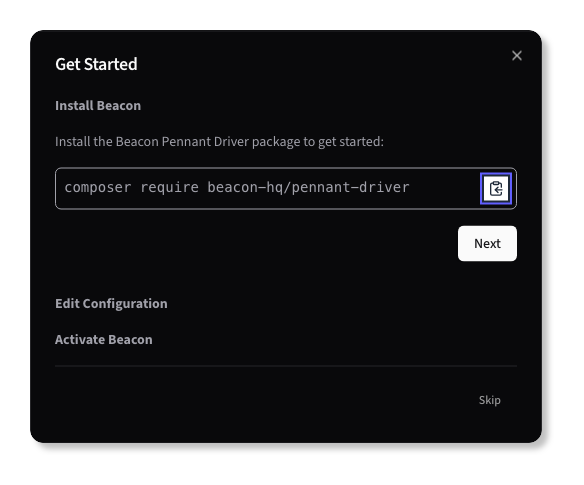
First, you will need to install the Beacon Pennant driver using Composer, click the Next button to proceed.
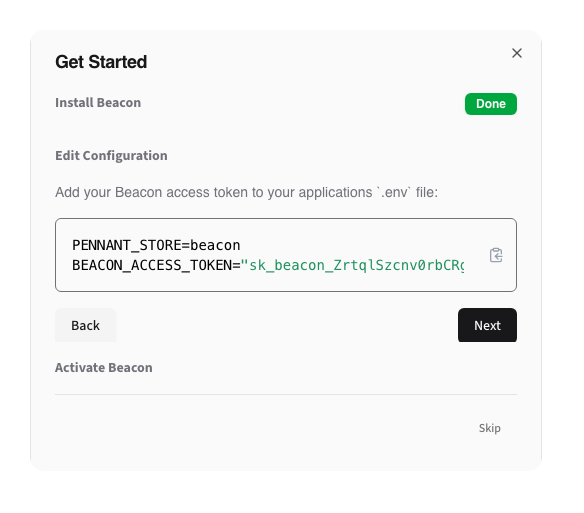
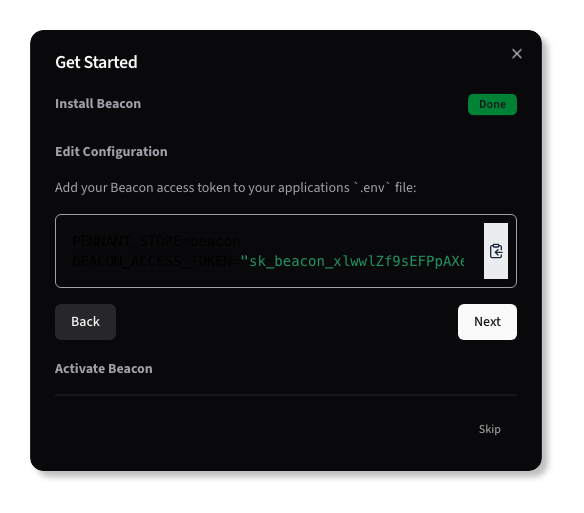
Next, you will be prompted to add the environment variables to add to your .env file. Click the Next button to proceed.
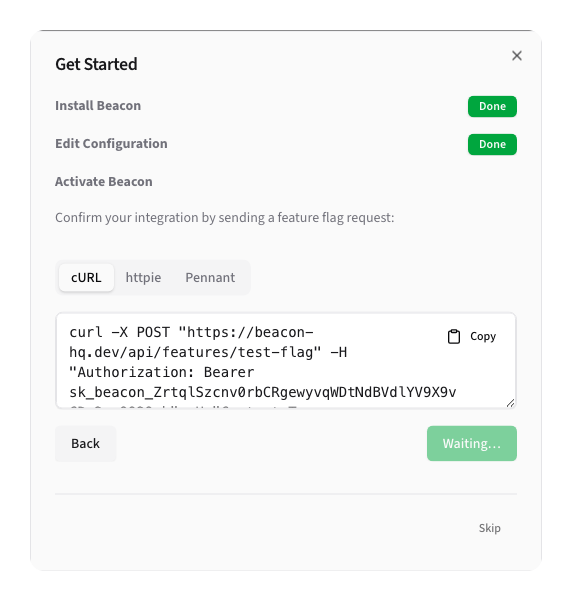
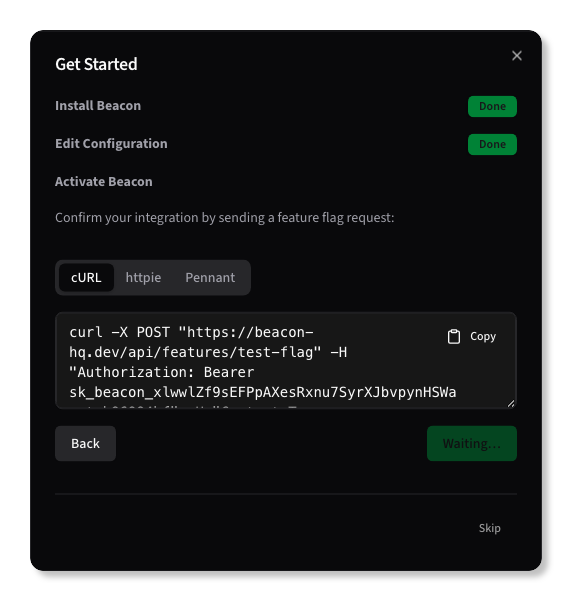
Finally, Beacon will guide you through testing the integration is functional, using cURL, httpie, or Pennant.
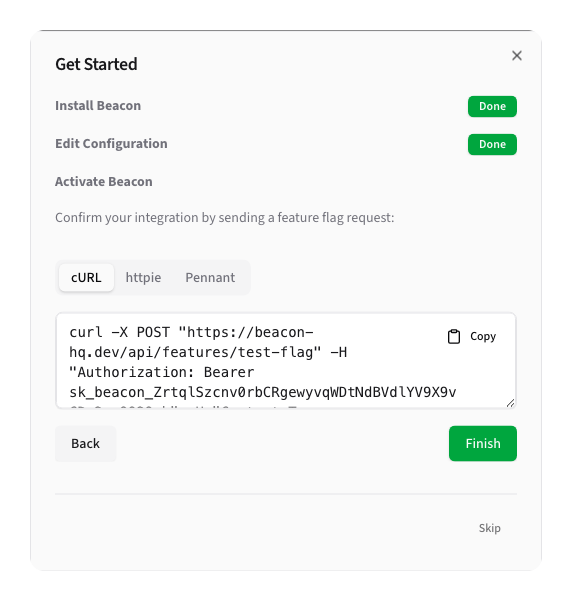
Once Beacon receives an evaluation request, you can click the Finish button to complete the onboarding.
TIP
If you are already familiar with Beacon setup, or have completed it manually, you can click Skip to hide it going forward.
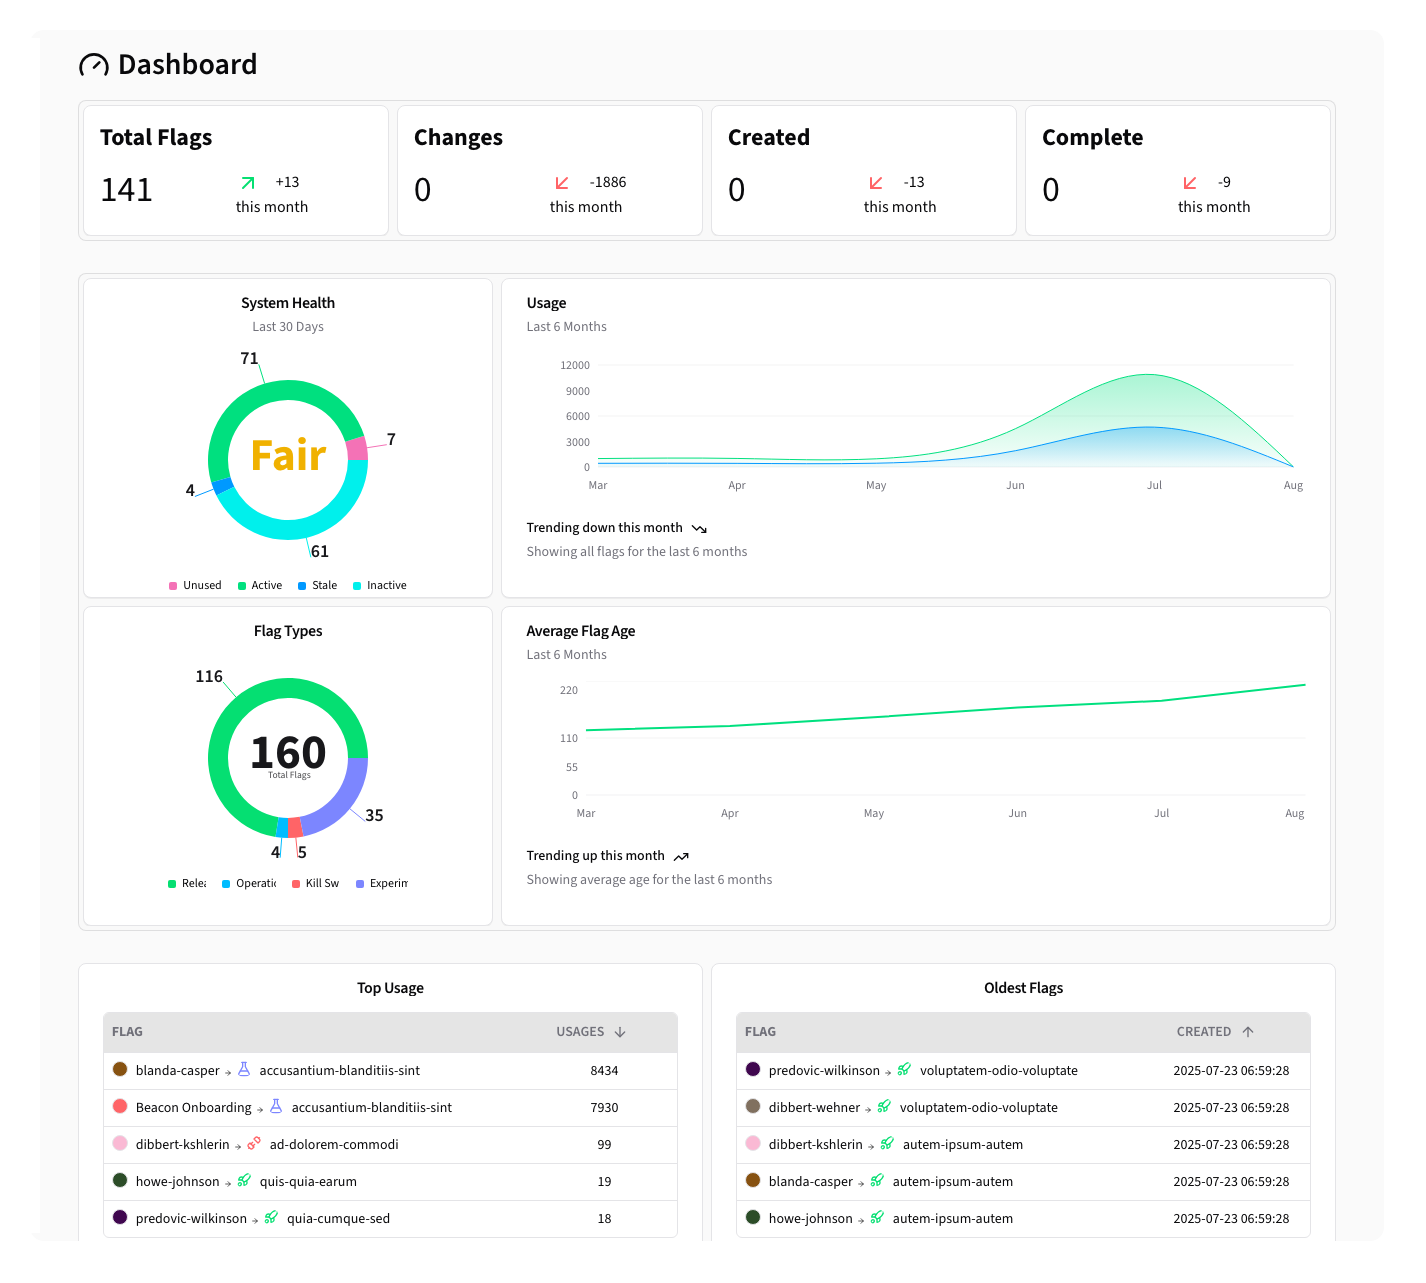
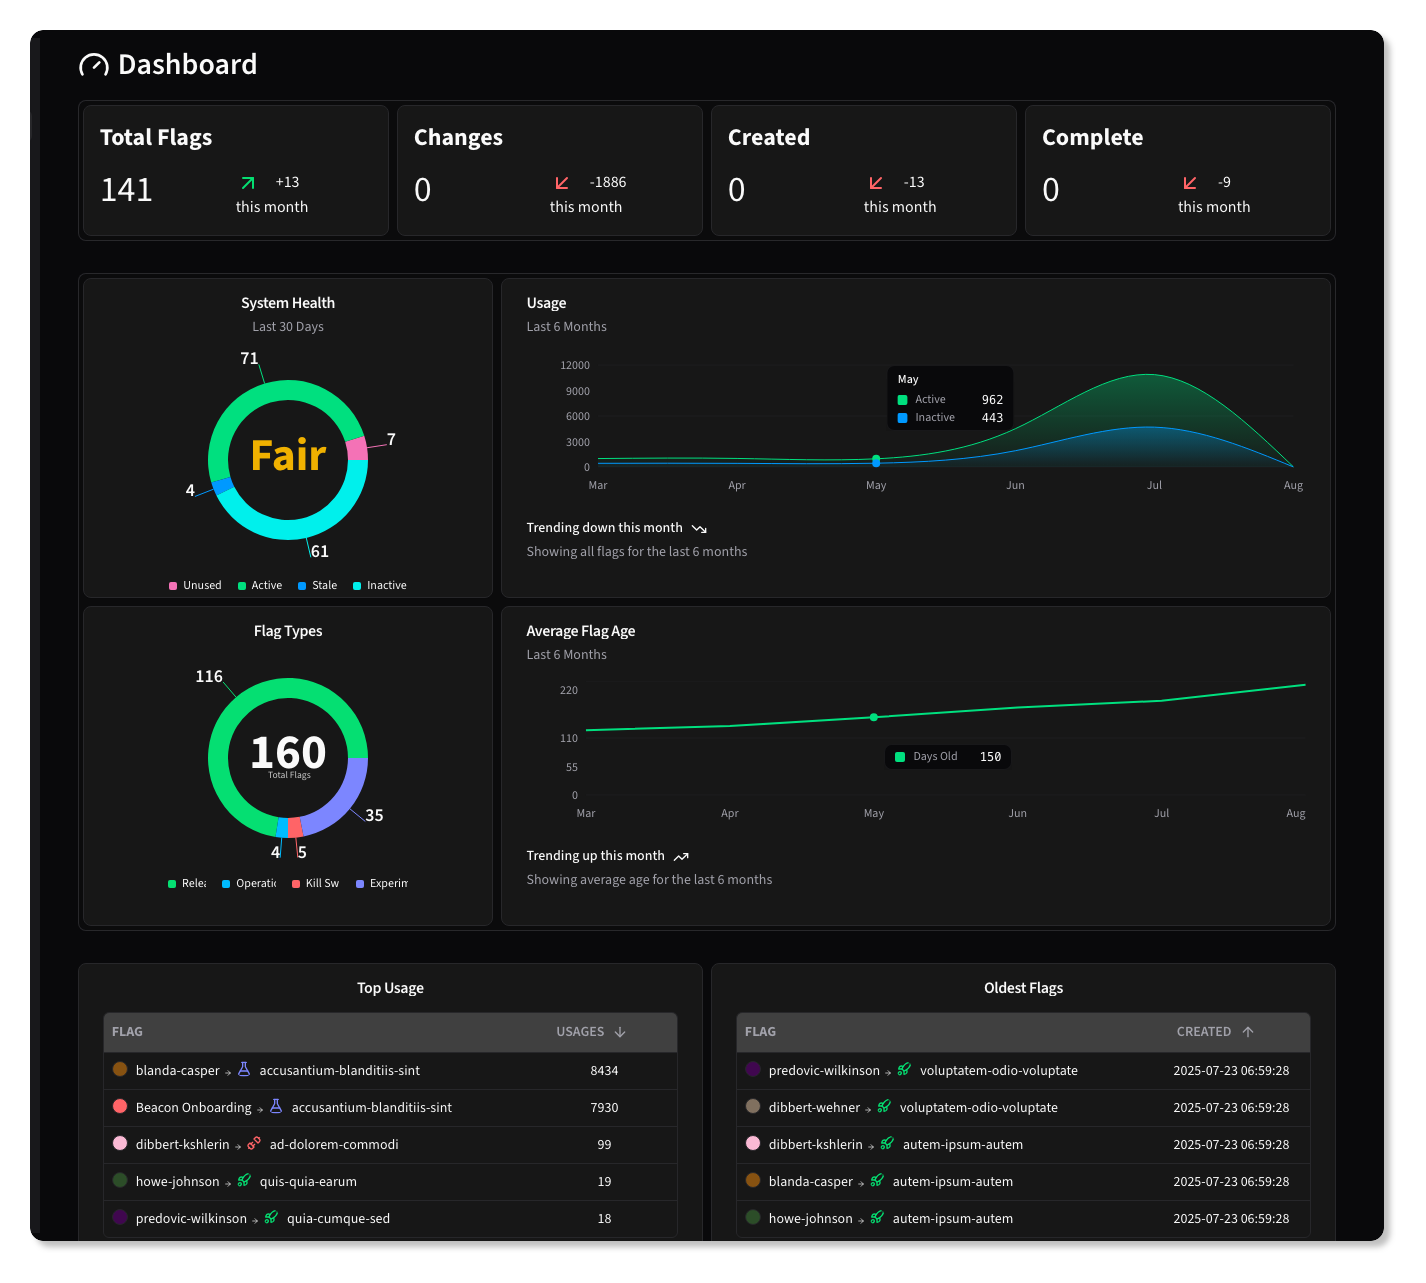
Metrics
The dashboard displays key metrics for your team:
Total Flags
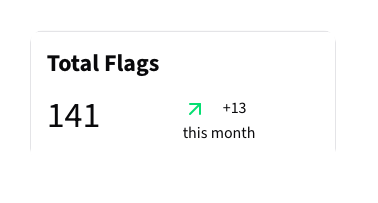
The total number of flags, as well as the difference from last month.
Changes This Month
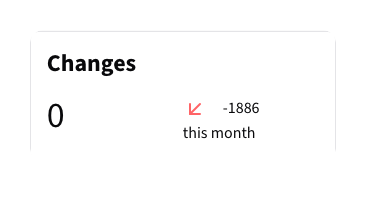

The number of changes this month — this includes the number of newly created flags, deleted flags, and any changes to the flags settings or configuration.
Created This Month
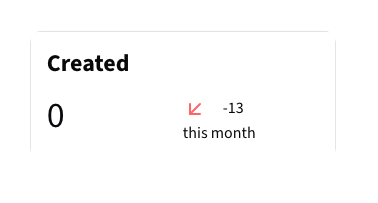
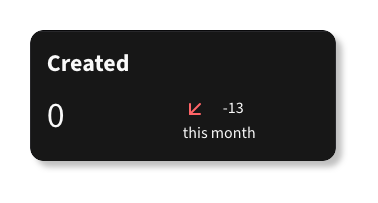
The number of flags created this month, as well as the difference compared to the number created in the previous month.
Completed This Month
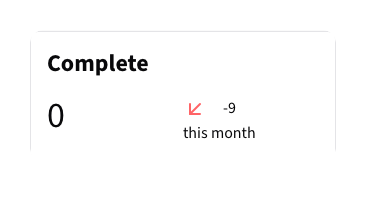
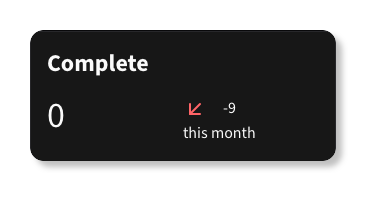
The number of feature flags marked as Completed this month, as well as the difference compared to the number completed in the previous month.
Health Scorecard
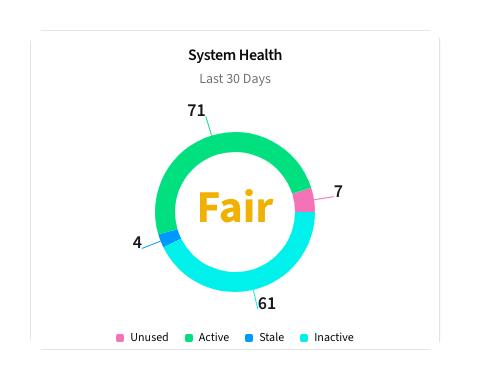
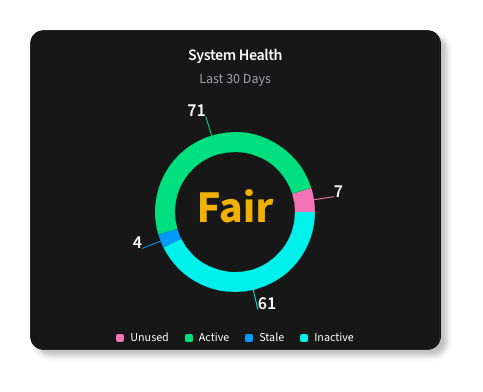
The Health Score is an at-a-glance metric that determines the overall health of your feature flags. It measures the number of active flags vs the number of unused, stale, and inactive flags.
Possible Health Scores are:
- Excellent
- Good
- Fair
- Poor
- Critical
Flag Types
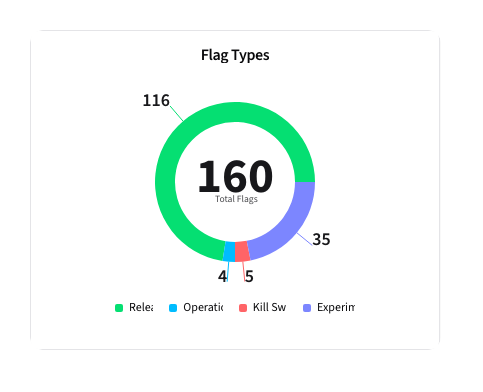
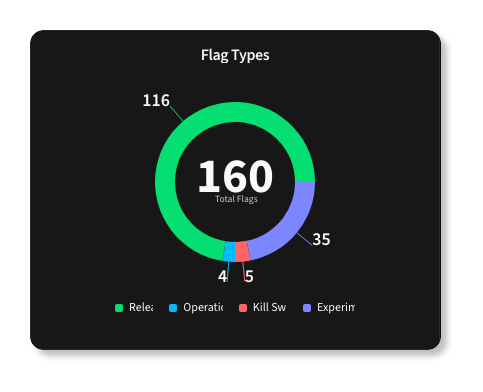
The distribution of feature flag types.
Usage
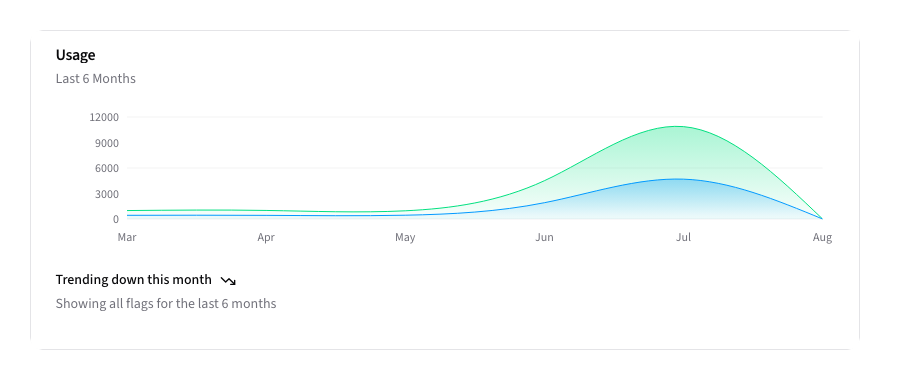
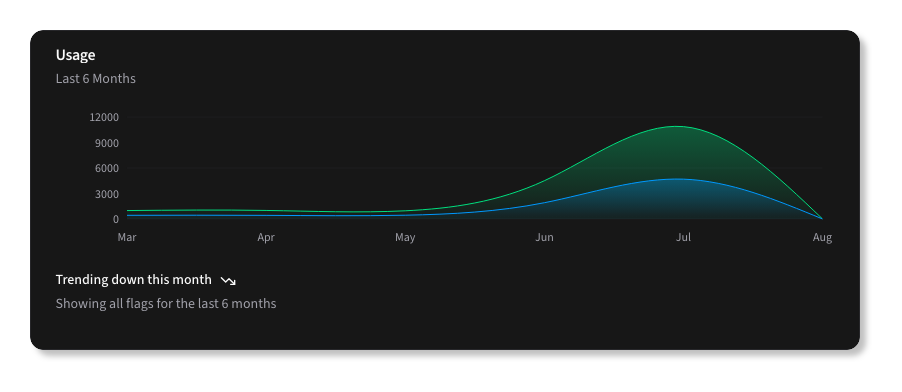
This graph shows the number of feature flag evaluations over time, and their active/inactive result.
Average Flag Age
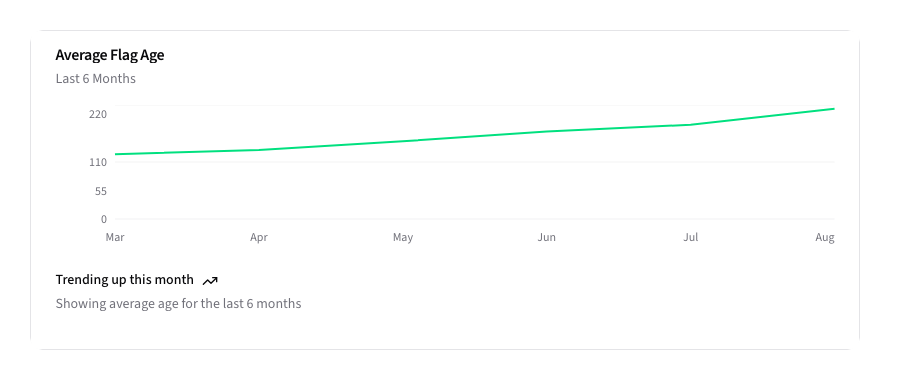
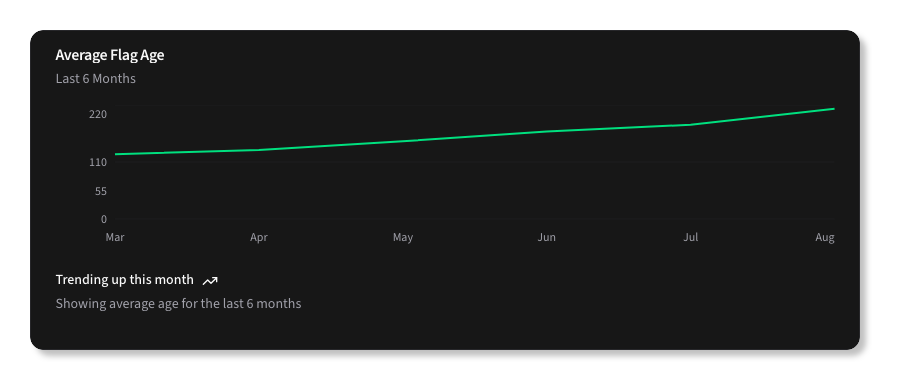
Line chart showing the average age of your feature flags over time.
Data Tables
Most Used Flags
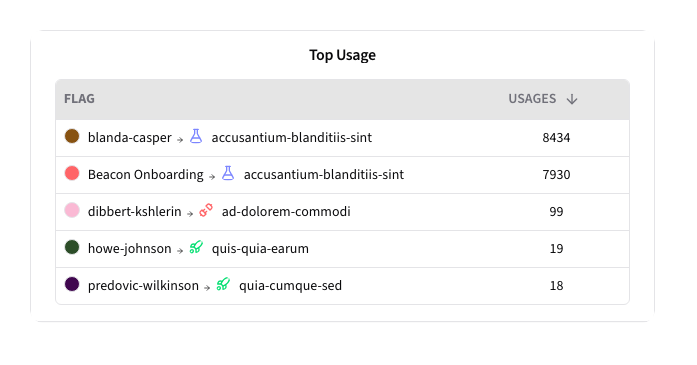
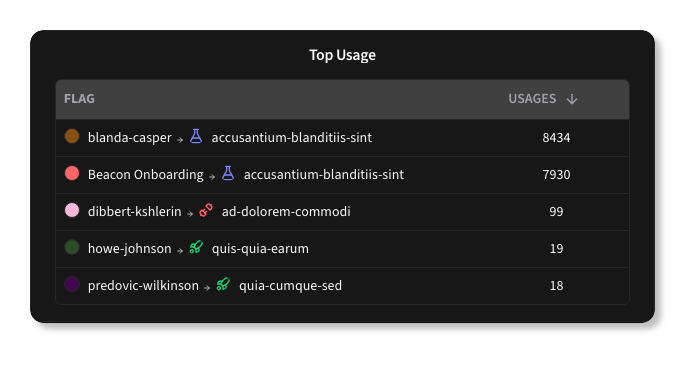
A list of the most evaluated flags.
Oldest Flags
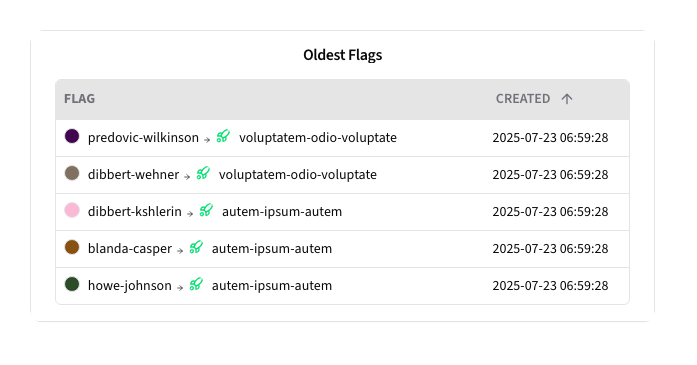
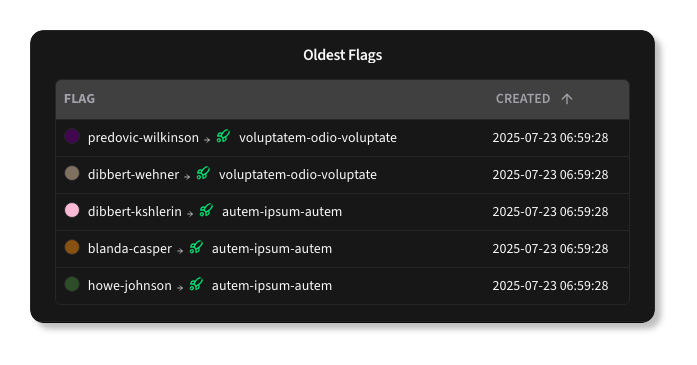
A list of the oldest flags.